pytesmo package
Subpackages
- pytesmo.colormaps package
- pytesmo.grid package
- pytesmo.io package
- pytesmo.time_series package
- pytesmo.timedate package
- pytesmo.validation_framework package
- Submodules
- pytesmo.validation_framework.adapters module
- pytesmo.validation_framework.data_manager module
- pytesmo.validation_framework.data_scalers module
- pytesmo.validation_framework.metric_calculators module
- pytesmo.validation_framework.results_manager module
- pytesmo.validation_framework.start_validation module
- pytesmo.validation_framework.temporal_matchers module
- pytesmo.validation_framework.validation module
- Module contents
Submodules
pytesmo.df_metrics module
Module contains wrappers for methods in pytesmo.metrics which can be given pandas.DataFrames instead of single numpy.arrays . If the DataFrame has more columns than the function has input parameters the function will be applied pairwise
Created on Aug 14, 2013
@author: Christoph Paulik Christoph.Paulik@geo.tuwien.ac.at
-
exception
pytesmo.df_metrics.DataFrameDimensionError[source]¶ Bases:
Exception-
args
-
with_traceback()¶ Exception.with_traceback(tb) – set self.__traceback__ to tb and return self.
-
-
pytesmo.df_metrics.RSS(df)[source]¶ Redidual sum of squares
Returns: result – with column names of df for which the calculation was done as name of the element separated by ‘_and_’ Return type: namedtuple See also
-
pytesmo.df_metrics.bias(df)[source]¶ Bias
Returns: bias – of shape (len(df.columns),len(df.columns)) Return type: pandas.Dataframe See also
-
pytesmo.df_metrics.kendalltau(df)[source]¶ Wrapper for scipy.stats.kendalltau
Returns: result – with column names of df for which the calculation was done as name of the element separated by ‘_and_’ Return type: namedtuple
-
pytesmo.df_metrics.mse(df)[source]¶ Mean square error (MSE) as a decomposition of the RMSD into individual error components
Returns: result – with column names of df for which the calculation was done as name of the element separated by ‘_and_’ Return type: namedtuple See also
-
pytesmo.df_metrics.nash_sutcliffe(df)[source]¶ Nash Sutcliffe model efficiency coefficient
Returns: result – with column names of df for which the calculation was done as name of the element separated by ‘_and_’ Return type: namedtuple See also
-
pytesmo.df_metrics.nrmsd(df)[source]¶ Normalized root-mean-square deviation
Returns: result – with column names of df for which the calculation was done as name of the element separated by ‘_and_’ Return type: namedtuple See also
-
pytesmo.df_metrics.pairwise_apply(df, method, comm=False)[source]¶ Compute given method pairwise for all columns, excluding NA/null values
Parameters: - df (pandas.DataFrame) – input data, method will be applied to each column pair
- method (function) – method to apply to each column pair. has to take 2 input arguments of type numpy.array and return one value or tuple of values
Returns: results
Return type:
-
pytesmo.df_metrics.pearsonr(df)[source]¶ Wrapper for scipy.stats.pearsonr
Returns: result – with column names of df for which the calculation was done as name of the element separated by ‘_and_’ Return type: namedtuple
-
pytesmo.df_metrics.rmsd(df)[source]¶ Root-mean-square deviation
Returns: result – with column names of df for which the calculation was done as name of the element separated by ‘_and_’ Return type: namedtuple See also
-
pytesmo.df_metrics.spearmanr(df)[source]¶ Wrapper for scipy.stats.spearmanr
Returns: result – with column names of df for which the calculation was done as name of the element separated by ‘_and_’ Return type: namedtuple See also
pytesmo.metrics.spearmenr(),scipy.stats.spearmenr()
-
pytesmo.df_metrics.tcol_error(df)[source]¶ Triple collocation error estimate In this case df has to have exactly 3 columns, since triple wise application of a function is not yet implemented and would probably return a complicated structure
Returns: result – with column names of df Return type: namedtuple See also
pytesmo.metrics module
-
pytesmo.metrics.RSS(o, p)[source]¶ Residual sum of squares.
Parameters: - o (numpy.ndarray) – Observations.
- p (numpy.ndarray) – Predictions.
Returns: res – Residual sum of squares.
Return type:
-
pytesmo.metrics.aad(o, p)[source]¶ Average (=mean) absolute deviation (AAD).
Parameters: - o (numpy.ndarray) – Observations.
- p (numpy.ndarray) – Predicitions.
Returns: d – Mean absolute deviation.
Return type:
-
pytesmo.metrics.bias(o, p)[source]¶ Difference of the mean values.
Parameters: - o (numpy.ndarray) – Observations.
- p (numpy.ndarray) – Predictions.
Returns: bias – Bias between observations and predictions.
Return type:
-
pytesmo.metrics.check_if_biased(combs, correlated)[source]¶ Supporting function for extended collocation Checks whether the estimators are biased by checking of not too manny data sets (are assumed to have cross-correlated errors)
-
pytesmo.metrics.ecol(data, correlated=None, err_cov=None, abs_est=True)[source]¶ - Extended collocation analysis to obtain estimates of:
- signal variances
- error variances
- signal-to-noise ratios [dB]
- error cross-covariances (and -correlations)
based on an arbitrary number of N>3 data sets.
!!! EACH DATA SET MUST BE MEMBER OF >= 1 TRIPLET THAT FULFILLS THE CLASSICAL TRIPLE COLLOCATION ASSUMPTIONS !!!
Parameters: - data (pd.DataFrame) – Temporally matched input data sets in each column
- correlated (tuple of tuples (string)) – A tuple containing tuples of data set names (column names), between which the error cross-correlation shall be estimated. e.g. [[‘AMSR-E’,’SMOS’],[‘GLDAS’,’ERA’]] estimates error cross-correlations between (AMSR-E and SMOS), and (GLDAS and ERA), respectively.
- err_cov – A priori known error cross-covariances that shall be included in the estimation (to obtain unbiased estimates)
- abs_est – Force absolute values for signal and error variance estimates (to mitiate the issue of estimation uncertainties)
Returns: - A dictionary with the following entries (<name> correspond to data set (df column’s) names
- - sig_<name> (signal variance of <name>)
- - err_<name> (error variance of <name>)
- - snr_<name> (SNR (in dB) of <name>)
- - err_cov_<name1>_<name2> (error covariance between <name1> and <name2>)
- - err_corr_<name1>_<name2> (error correlation between <name1> and <name2>)
Notes
Rescaling parameters can be derived from the signal variances e.g., scaling <src> against <ref>: beta = np.sqrt(sig_<ref> / sig_<src>) rescaled = (data[<src>] - data[<src>].mean()) * beta + data[<ref>].mean()
References
[Gruber2016] Gruber, A., Su, C. H., Crow, W. T., Zwieback, S., Dorigo, W. A., & Wagner, W. (2016). Estimating error cross-correlations in soil moisture data sets using extended collocation analysis. Journal of Geophysical Research: Atmospheres, 121(3), 1208-1219.
-
pytesmo.metrics.index_of_agreement(o, p)[source]¶ Index of agreement was proposed by Willmot (1981), to overcome the insenstivity of Nash-Sutcliffe efficiency E and R^2 to differences in the observed and predicted means and variances (Legates and McCabe, 1999). The index of agreement represents the ratio of the mean square error and the potential error (Willmot, 1984). The potential error in the denominator represents the largest value that the squared difference of each pair can attain. The range of d is similar to that of R^2 and lies between 0 (no correlation) and 1 (perfect fit).
Parameters: - o (numpy.ndarray) – Observations.
- p (numpy.ndarray) – Predictions.
Returns: d – Index of agreement.
Return type:
-
pytesmo.metrics.kendalltau(o, p)[source]¶ Wrapper for scipy.stats.kendalltau
Parameters: - o (numpy.array) – Observations.
- p (numpy.array) – Predictions.
Returns: - Kendall’s tau (float) – The tau statistic
- p-value (float) – The two-sided p-palue for a hypothesis test whose null hypothesis is an absence of association, tau = 0.
See also
-
pytesmo.metrics.mad(o, p)[source]¶ Median absolute deviation (MAD).
Parameters: - o (numpy.ndarray) – Observations.
- p (numpy.ndarray) – Predicitions.
Returns: d – Median absolute deviation.
Return type:
-
pytesmo.metrics.mse(o, p, ddof=0)[source]¶ Mean square error (MSE) as a decomposition of the RMSD into individual error components. The MSE is the second moment (about the origin) of the error, and thus incorporates both the variance of the estimator and its bias. For an unbiased estimator, the MSE is the variance of the estimator. Like the variance, MSE has the same units of measurement as the square of the quantity being estimated. The delta degree of freedom keyword (ddof) can be used to correct for the case the true variance is unknown and estimated from the population. Concretely, the naive sample variance estimator sums the squared deviations and divides by n, which is biased. Dividing instead by n - 1 yields an unbiased estimator.
Parameters: - o (numpy.ndarray) – Observations.
- p (numpy.ndarray) – Predictions.
- ddof (int, optional) – Delta degree of freedom.The divisor used in calculations is N - ddof, where N represents the number of elements. By default ddof is zero.
Returns: - mse (float) – Mean square error (MSE).
- mse_corr (float) – Correlation component of MSE.
- mse_bias (float) – Bias component of the MSE.
- mse_var (float) – Variance component of the MSE.
-
pytesmo.metrics.nash_sutcliffe(o, p)[source]¶ Nash Sutcliffe model efficiency coefficient E. The range of E lies between 1.0 (perfect fit) and -inf.
Parameters: - o (numpy.ndarray) – Observations.
- p (numpy.ndarray) – Predictions.
Returns: E – Nash Sutcliffe model efficiency coefficient E.
Return type:
-
pytesmo.metrics.nrmsd(o, p, ddof=0)[source]¶ Normalized root-mean-square deviation (nRMSD).
Parameters: - o (numpy.ndarray) – Observations.
- p (numpy.ndarray) – Predictions.
- ddof (int, optional) – Delta degree of freedom.The divisor used in calculations is N - ddof, where N represents the number of elements. By default ddof is zero.
Returns: nrmsd – Normalized root-mean-square deviation (nRMSD).
Return type:
-
pytesmo.metrics.pearson_conf(r, n, c=95)[source]¶ Calcalates the confidence interval of a given pearson correlation coefficient using a fisher z-transform, only valid for correlation coefficients calculated from a bivariate normal distribution
Parameters: - r (float or numpy.ndarray) – Correlation coefficient
- n (int or numpy.ndarray) – Number of observations used in determining the correlation coefficient
- c (float) – Level of confidence in percent, from 0-100.
Returns: - r_lower (float or numpy.ndarray) – Lower confidence boundary.
- r_upper (float or numpy.ndarray) – Upper confidence boundary.
-
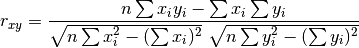
pytesmo.metrics.pearsonr(o, p)[source]¶ Wrapper for scipy.stats.pearsonr. Calculates a Pearson correlation coefficient and the p-value for testing non-correlation.
Parameters: - o (numpy.ndarray) – Observations.
- p (numpy.ndarray) – Predictions.
Returns: - r (float) – Pearson’s correlation coefficent.
- p-value (float) – 2 tailed p-value.
See also
-
pytesmo.metrics.pearsonr_recursive(x, y, n_old=0, sum_xi_yi=0, sum_xi=0, sum_yi=0, sum_x2=0, sum_y2=0)[source]¶ Calculate pearson correlation in a recursive manner based on
Parameters: - x (numpy.ndarray) – New values for x
- y (numpy.ndarray) – New values for y
- n_old (float, optional) – number of observations from previous pass
- sum_xi_yi (float, optional) –

from previous pass
- sum_xi (float, optional) –

from previous pass
- sum_yi (float, optional) –

from previous pass
- sum_x2 (float, optional) –

from previous pass
- sum_y2 (float, optional) –

from previous pass
Returns: - r (float) – Pearson correlation coefficient
- params (tuple) – tuple of (n_new, sum_xi_yi, sum_xi, sum_yi, sum_x2, sum_y2) .
Can be used when calling the next iteration as
*params.
-
pytesmo.metrics.rmsd(o, p, ddof=0)[source]¶ Root-mean-square deviation (RMSD). It is implemented for an unbiased estimator, which means the RMSD is the square root of the variance, also known as the standard error. The delta degree of freedom keyword (ddof) can be used to correct for the case the true variance is unknown and estimated from the population. Concretely, the naive sample variance estimator sums the squared deviations and divides by n, which is biased. Dividing instead by n -1 yields an unbiased estimator
Parameters: - o (numpy.ndarray) – Observations.
- p (numpy.ndarray) – Predictions.
- ddof (int, optional) – Delta degree of freedom.The divisor used in calculations is N - ddof, where N represents the number of elements. By default ddof is zero.
Returns: rmsd – Root-mean-square deviation.
Return type:
-
pytesmo.metrics.spearmanr(o, p)[source]¶ Wrapper for scipy.stats.spearmanr. Calculates a Spearman rank-order correlation coefficient and the p-value to test for non-correlation.
Parameters: - o (numpy.ndarray) – Observations.
- p (numpy.ndarray) – Predictions.
Returns: - rho (float) – Spearman correlation coefficient
- p-value (float) – The two-sided p-value for a hypothesis test whose null hypothesis is that two sets of data are uncorrelated
See also
scipy.stats.spearmenr()
-
pytesmo.metrics.tcol_error(x, y, z)[source]¶ Triple collocation error estimate of three calibrated/scaled datasets.
Parameters: - x (numpy.ndarray) – 1D numpy array to calculate the errors
- y (numpy.ndarray) – 1D numpy array to calculate the errors
- z (numpy.ndarray) – 1D numpy array to calculate the errors
Returns: - e_x (float) – Triple collocation error for x.
- e_y (float) – Triple collocation error for y.
- e_z (float) – Triple collocation error for z.
Notes
This function estimates the triple collocation error based on already scaled/calibrated input data. It follows formula 4 given in [Scipal2008].
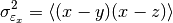
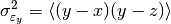
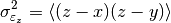
where the
 brackets mean the temporal mean.
References
[Scipal2008] Scipal, K., Holmes, T., De Jeu, R., Naeimi, V., & Wagner, W. (2008). A possible solution for the problem of estimating the error structure of global soil moisture data sets. Geophysical Research Letters, 35(24), .
-
pytesmo.metrics.tcol_snr(x, y, z, ref_ind=0)[source]¶ triple collocation based estimation of signal-to-noise ratio, absolute errors, and rescaling coefficients
Parameters: - x (1D numpy.ndarray) – first input dataset
- y (1D numpy.ndarray) – second input dataset
- z (1D numpy.ndarray) – third input dataset
- ref_ind (int) – index of reference data set for estimating scaling coefficients. default: 0 (x)
Returns: - snr (numpy.ndarray) – signal-to-noise (variance) ratio [dB]
- err_std (numpy.ndarray) – SCALED error standard deviation
- beta (numpy.ndarray) – scaling coefficients (i_scaled = i * beta_i)
Notes
This function estimates the triple collocation errors, the scaling parameter
 and the signal to noise ratio directly from the
covariances of the dataset. For a general overview and how this function and
and the signal to noise ratio directly from the
covariances of the dataset. For a general overview and how this function and
pytesmo.metrics.tcol_error()are related please see [Gruber2015].Estimation of the error variances from the covariances of the datasets (e.g.
 for the covariance between
  and
and
 ) is done using the following formula:
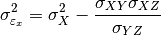
 can also be estimated from the covariances:


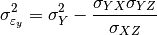
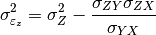
The signal to noise ratio (SNR) is also calculated from the variances and covariances:
![\text{SNR}_X[dB] = -10\log\left(\frac{\sigma_{X}^2\sigma_{YZ}}{\sigma_{XY}\sigma_{XZ}}-1\right)](../_images/math/6511d3daa68ec867e19a11603a8755db45a97891.png)
![\text{SNR}_Y[dB] = -10\log\left(\frac{\sigma_{Y}^2\sigma_{XZ}}{\sigma_{YX}\sigma_{YZ}}-1\right)](../_images/math/1bf8cd557a2eafbdf555770b7c97218ad1f4afb9.png)
![\text{SNR}_Z[dB] = -10\log\left(\frac{\sigma_{Z}^2\sigma_{XY}}{\sigma_{ZX}\sigma_{ZY}}-1\right)](../_images/math/ed3dd87b28d2853937a93c1c23f7244d3aaf3b25.png)
It is given in dB to make it symmetric around zero. If the value is zero it means that the signal variance and the noise variance are equal. +3dB means that the signal variance is twice as high as the noise variance.
References
[Gruber2015] Gruber, A., Su, C., Zwieback, S., Crow, W., Dorigo, W., Wagner, W. (2015). Recent advances in (soil moisture) triple collocation analysis. International Journal of Applied Earth Observation and Geoinformation, in review
-
pytesmo.metrics.ubrmsd(o, p, ddof=0)[source]¶ Unbiased root-mean-square deviation (uRMSD).
Parameters: - o (numpy.ndarray) – Observations.
- p (numpy.ndarray) – Predictions.
- ddof (int, optional) – Delta degree of freedom.The divisor used in calculations is N - ddof, where N represents the number of elements. By default ddof is zero.
Returns: urmsd – Unbiased root-mean-square deviation (uRMSD).
Return type:
pytesmo.scaling module
Created on Apr 17, 2013
@author: Christoph Paulik christoph.paulik@geo.tuwien.ac.at
-
pytesmo.scaling.add_scaled(df, method='linreg', label_in=None, label_scale=None)[source]¶ takes a dataframe and appends a scaled time series to it. If no labels are given the first column will be scaled to the second column of the DataFrame
Parameters: - df (pandas.DataFrame) – input dataframe
- method (string) – scaling method
- label_in (string, optional) – the column of the dataframe that should be scaled to that with label_scale default is the first column
- label_scale (string, optional) – the column of the dataframe the label_in column should be scaled to default is the second column
Returns: df – input dataframe with new column labeled label_in+’_scaled_’+method
Return type:
-
pytesmo.scaling.cdf_match(src, ref, min_val=None, max_val=None, nbins=100)[source]¶ computes cumulative density functions of src and ref at their respective bin-edges by 5th order spline interpolation; then matches CDF of src to CDF of ref.
This function does not make sure that the percentiles are unique so it can happen that multiple measurements are scaled to one point or that there are NaN values in the output array.
Parameters: - src (numpy.array) – input dataset which will be scaled
- ref (numpy.array) – src will be scaled to this dataset
- min_val (float, optional) – Minimum allowed value, output data is capped at this value
- max_val (float, optional) – Maximum allowed value, output data is capped at this value
- nbins (int, optional) – Number of bins to use for estimation of the CDF
Returns: CDF matched values – dataset src with CDF as ref
Return type:
-
pytesmo.scaling.gen_cdf_match(src, perc_src, perc_ref, min_val=None, max_val=None, k=1)[source]¶ General cdf matching:
- computes discrete cumulative density functions of src- and ref at the given percentiles
- computes continuous CDFs by k-th order spline fitting
- CDF of src is matched to CDF of ref
Parameters: - src (numpy.array) – input dataset which will be scaled
- perc_src (numpy.array) – percentiles of src
- perc_ref (numpy.array) – percentiles of reference data estimated through method of choice, must be same size as perc_src
- min_val (float, optional) – Minimum allowed value, output data is capped at this value
- max_val (float, optional) – Maximum allowed value, output data is capped at this value
- k (int, optional) – Order of spline to fit
Returns: CDF matched values – dataset src with CDF as ref
Return type:
-
pytesmo.scaling.get_scaling_function(method)[source]¶ Get scaling function based on method name.
Parameters: method (string) – method name as string Returns: scaling_func – function(src:numpy.ndarray, ref:numpy.ndarray) > scaled_src:np.ndarray Return type: function Raises: KeyError: – if method is not found
-
pytesmo.scaling.get_scaling_method_lut()[source]¶ Get all defined scaling methods and their function names.
Returns: lut – key: scaling method name value: function Return type: dictionary
-
pytesmo.scaling.lin_cdf_match(src, ref, min_val=None, max_val=None, percentiles=[0, 5, 10, 30, 50, 70, 90, 95, 100])[source]¶ computes cumulative density functions of src and ref at their respective bin-edges by linear interpolation; then matches CDF of src to CDF of ref.
This function does not make sure that the percentiles are unique so it can happen that multiple measurements are scaled to one point or that there are NaN values in the output array.
Parameters: - src (numpy.array) – input dataset which will be scaled
- ref (numpy.array) – src will be scaled to this dataset
- min_val (float, optional) – Minimum allowed value, output data is capped at this value
- max_val (float, optional) – Maximum allowed value, output data is capped at this value
- percentiles (list or numpy.ndarray) – Percentiles to use for CDF matching
Returns: CDF matched values – dataset src with CDF as ref
Return type:
-
pytesmo.scaling.lin_cdf_match_stored_params(src, perc_src, perc_ref, min_val=None, max_val=None)[source]¶ Performs cdf matching using given percentiles.
Parameters: - src (numpy.array) – input data to scale
- perc_src (numpy.array) – percentiles of src estimated through method of choice
- perc_ref (numpy.array) – percentiles of reference data estimated through method of choice, must be same size as perc_src
- min_val (float, optional) – Minimum allowed value, output data is capped at this value
- max_val (float, optional) – Maximum allowed value, output data is capped at this value
-
pytesmo.scaling.linreg(src, ref)[source]¶ scales the input datasets using linear regression
Parameters: - src (numpy.array) – input dataset which will be scaled
- ref (numpy.array) – src will be scaled to this dataset
Returns: scaled dataset – dataset scaled using linear regression
Return type:
-
pytesmo.scaling.mean_std(src, ref)[source]¶ scales the input datasets so that they have the same mean and standard deviation afterwards
Parameters: - src (numpy.array) – input dataset which will be scaled
- ref (numpy.array) – src will be scaled to this dataset
Returns: scaled dataset – dataset src with same mean and standard deviation as ref
Return type:
-
pytesmo.scaling.min_max(src, ref)[source]¶ scales the input datasets so that they have the same minimum and maximum afterwards
Parameters: - src (numpy.array) – input dataset which will be scaled
- ref (numpy.array) – src will be scaled to this dataset
Returns: scaled dataset – dataset src with same maximum and minimum as ref
Return type:
-
pytesmo.scaling.scale(df, method='linreg', reference_index=0)[source]¶ takes pandas.DataFrame and scales all columns to the column specified by reference_index with the chosen method
Parameters: - df (pandas.DataFrame) – containing matched time series that should be scaled
- method (string, optional) – method definition, has to be a function in globals() that takes 2 numpy.array as input and returns one numpy.array of same length
- reference_index (int, optional) – default 0, column index of reference dataset in dataframe
Returns: scaled data – all time series of the input DataFrame scaled to the one specified by reference_index
Return type:
pytesmo.temporal_matching module
Provides a temporal matching function
-
pytesmo.temporal_matching.df_match(reference, *args, **kwds)[source]¶ Finds temporal match between the reference pandas.DataFrame (index has to be datetime) and n other pandas.DataFrame (index has to be datetime).
Parameters: - reference (pandas.DataFrame or pandas.TimeSeries) – The index of this dataframe will be the reference.
- *args (pandas.DataFrame or pandas.TimeSeries) – The index of this dataframe(s) will be matched. If it is a pandas.Series then it has to have a name. Otherwise no column name can be assigned to the matched DataFrame.
- window (float) – Fraction of days of the maximum pos./neg. distance allowed, i.e. the value of window represents the half-winow size (e.g. window=0.5, will search for matches between -12 and +12 hours) (default: None)
- dropna (boolean) – Drop rows containing only NaNs (default: False)
- dropduplicates (boolean) – Drop duplicated temporal matched (default: False)
- asym_window (string, optional) –
<=stands for using a smaller and equal only for the left/smaller side of the window comparison>=stands for using a larger and equal only for the right/larger side of the window comparison The default is to use <= and >= for both sides of the search window
Returns: temporal_matched_args – Dataframe with index from matched reference index
Return type: pandas.DataFrame or tuple of pandas.DataFrame
-
pytesmo.temporal_matching.matching(reference, *args, **kwargs)[source]¶ Finds temporal match between the reference pandas.TimeSeries (index has to be datetime) and n other pandas.TimeSeries (index has to be datetime).
Parameters: - reference (pandas.TimeSeries) – The index of this Series will be the reference.
- *args (pandas.TimeSeries) – The index of these Series(s) will be matched.
- window (float) – Fraction of days of the maximum pos./neg. distance allowed, i.e. the value of window represents the half-winow size (e.g. window=0.5, will search for matches between -12 and +12 hours) (default: None)
Returns: temporal_match – containing the index of the reference Series and a column for each of the other input Series
Return type:
pytesmo.utils module
Module containing utility functions that do not fit into other modules
-
pytesmo.utils.element_iterable(el)[source]¶ Test if a element is iterable
Parameters: el (object) – Returns: iterable – if True then then el is iterable if Fales then not Return type: boolean
-
pytesmo.utils.ensure_iterable(el)[source]¶ Ensure that an object is iterable by putting it into a list. Strings are handled slightly differently. They are technically iterable but we want to keep the whole.
Parameters: el (object) – Returns: iterable – [el] Return type: list
-
pytesmo.utils.interp_uniq(src)[source]¶ replace non unique values by their linear interpolated value This method interpolates iteratively like it is done in IDL.
Parameters: src (numpy.array) – array to ensure uniqueness of Returns: src – interpolated unique values in array of same size as src Return type: numpy.array
-
pytesmo.utils.ml_percentile(in_data, percentiles)[source]¶ Calculate percentiles in the way Matlab and IDL do it.
By using interpolation between the lowest an highest rank and the minimum and maximum outside.
Parameters: - in_data (numpy.ndarray) – input data
- percentiles (numpy.ndarray) – percentiles at which to calculate the values
Returns: perc – values of the percentiles
Return type:
-
pytesmo.utils.unique_percentiles_beta(perc_values, percentiles)[source]¶ Compute unique percentile values by fitting the CDF of a beta distribution to the percentiles.
Parameters: - perc_values (list or numpy.ndarray) – calculated values for the given percentiles
- percentiles (list or numpy.ndarray) – Percentiles to use for CDF matching
Returns: uniq_perc_values – Unique percentile values generated through fitting the CDF of a beta distribution.
Return type: Raises: RuntimeError– If no fit could be found.
-
pytesmo.utils.unique_percentiles_interpolate(perc_values, percentiles=[0, 5, 10, 30, 50, 70, 90, 95, 100], k=1)[source]¶ Try to ensure that percentile values are unique and have values for the given percentiles.
If only all the values in perc_values are the same. The array is unchanged.
Parameters: - perc_values (list or numpy.ndarray) – calculated values for the given percentiles
- percentiles (list or numpy.ndarray) – Percentiles to use for CDF matching
- k (int) – Degree of spline interpolation to use for filling duplicate percentile values
Returns: uniq_perc_values – Unique percentile values generated through linear interpolation over removed duplicate percentile values
Return type: